

Understanding how much electricity a solar photovoltaic (PV) system will generate is fundamental to project planning, financial modeling, and performance evaluation. While no prediction is exact, standardized calculation methods provide reliable estimates. This article outlines the core formula, key influencing factors, and practical considerations for accurate generation forecasting.
1. The Basic Calculation Formula
The most widely used method for estimating annual solar PV generation is:
E = A × G × PR
| Variable | Meaning | Typical Value Range |
|---|---|---|
| E | Annual energy output (kWh) | – |
| A | Total solar panel area (m²) or total system capacity (kWp) | – |
| G | Annual solar irradiation on the plane of the array (kWh/m²/year) | Varies by location (1,000–2,500 kWh/m²/year) |
| PR | Performance Ratio | 0.75 – 0.85 (new systems) |
Alternatively, using system capacity:
E = P × G × PR
Where P = total installed peak power (kWp), and G = annual irradiation in kWh/kWp (peak sun hours × 365).
2. Step-by-Step Calculation Example
Assume:
System size: 5 kWp
Location: Southern California
Annual irradiation: 1,800 kWh/m²/year (≈ 4.93 peak sun hours/day)
Performance Ratio: 0.80
Annual generation = 5 kWp × 1,800 kWh/kWp × 0.80 = 7,200 kWh/year
This translates to approximately 19.7 kWh/day on average.
3. Factors Influencing PV System Generation
3.1 Solar Irradiation & Geographic Location
Irradiation is the single most significant factor. It varies by:
Latitude: Regions closer to the equator receive higher irradiation.
Climate: Desert regions have high irradiation; cloudy or high-latitude regions have lower values.
Tilt & Orientation: Panels oriented south (in the Northern Hemisphere) at an optimal tilt angle (typically equal to latitude) maximize exposure.
| Location | Annual Irradiation (kWh/m²/year) |
|---|---|
| Desert Southwest, USA | 2,200 – 2,500 |
| Southern Europe | 1,600 – 1,900 |
| Northern Europe | 1,000 – 1,300 |
| Southeast Asia | 1,400 – 1,800 |
3.2 System Capacity & Panel Efficiency
Installed capacity (kWp): Larger systems produce more energy proportionally.
Panel efficiency: Higher efficiency panels (20–22%) generate more power per square meter, beneficial for space-constrained roofs.
3.3 Performance Ratio (PR)
PR accounts for all system losses. A well-designed system typically achieves PR of 0.80–0.85. Key loss components include:
| Loss Factor | Typical Range |
|---|---|
| Inverter efficiency | 95% – 98% |
| DC/AC cabling losses | 1% – 3% |
| Soiling (dust, snow, bird droppings) | 2% – 10% (varies by environment) |
| Shading | 0% – 30% (site-dependent) |
| Temperature losses | 5% – 10% |
| Mismatch & module degradation | 1% – 3% |
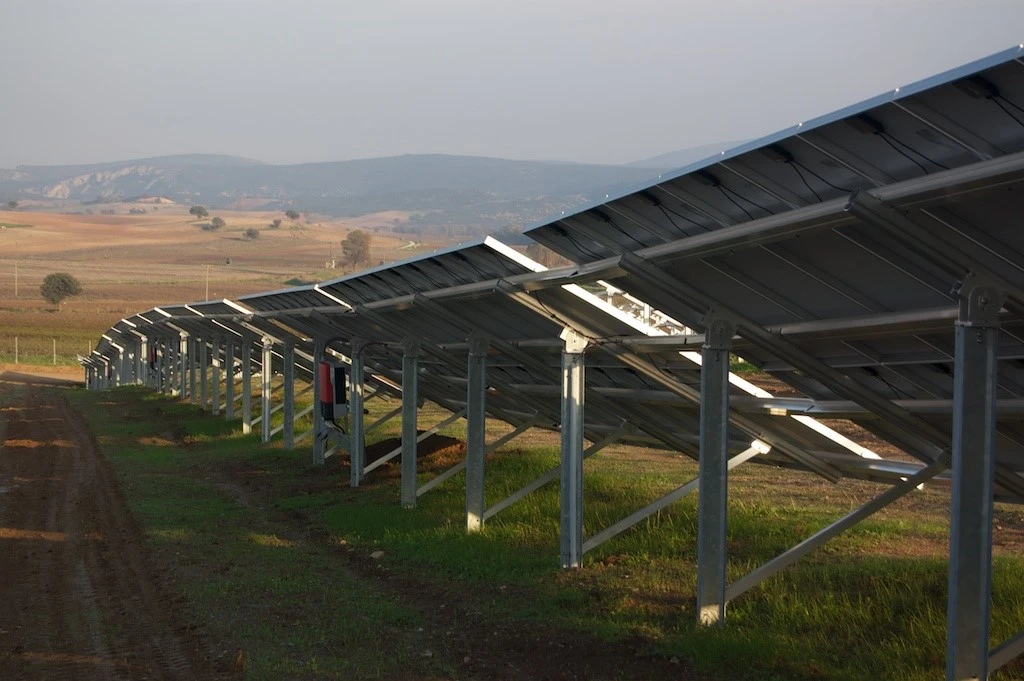
3.4 Mounting System & Site Conditions
The mounting structure significantly impacts generation:
Tilt angle: Fixed-tilt systems vs. adjustable or tracking systems. Single-axis tracking can increase generation by 15–25%; dual-axis tracking by 25–35%.
Roof vs. ground mount: Ground-mounted systems allow optimal orientation and easier maintenance.
Airflow & cooling: Elevated mounting allows airflow beneath panels, reducing operating temperature and improving efficiency.
3.5 Shading
Shading from trees, chimneys, neighboring buildings, or other obstructions can drastically reduce output. Even partial shading of a single panel can disproportionately impact string inverter performance. Mitigation strategies include:
Microinverters or power optimizers
Careful site planning and module layout
Appropriate mounting height to minimize edge-of-array shading
3.6 Temperature
PV panels operate less efficiently at high temperatures. Temperature coefficients typically range from -0.3% to -0.4% per °C above standard test conditions (25°C). In hot climates, this can result in 5–10% annual energy loss.
3.7 Soiling & Maintenance
Dust, pollen, snow, and bird droppings reduce light transmission. In dry, dusty regions, soiling can cause 5–15% annual loss without regular cleaning. Maintenance frequency should be factored into generation estimates.
4. Advanced Calculation Methods
For more precise estimates, consider:
| Method | Description |
|---|---|
| PVWatts (NREL) | Free online tool using historical TMY data for locations worldwide |
| PVsyst | Industry-standard software for detailed system simulation, accounting for shading, temperature, and component characteristics |
| HelioScope / PVcase | Advanced design and simulation platforms for commercial and utility-scale projects |
These tools incorporate site-specific weather data, shading analysis, and component databases to generate hour-by-hour performance simulations.
5. Practical Considerations for Accurate Estimates
5.1 Use Local Solar Irradiation Data
Generic national averages are insufficient. Use tools like NASA SSE, Solargis, or local meteorological data for site-specific irradiation values.
5.2 Account for Degradation
PV panels degrade over time, typically 0.3–0.8% annually. A 25-year generation forecast should reflect this decline.
5.3 Consider Inverter Clipping
Inverters have maximum DC input limits. Oversizing the array beyond inverter capacity results in "clipping"-energy lost when DC exceeds inverter capacity, which may be acceptable depending on cost-benefit analysis.
5.4 Include System Availability
Assume 1–3% annual downtime for inverter failures, maintenance, or grid outages unless redundant systems are in place.

6. Summary of Key Influencing Factors
| Factor | Impact on Generation |
|---|---|
| Solar irradiation | Most significant; varies by location |
| System orientation & tilt | Optimizing can increase yield by 10–30% |
| Shading | Can reduce output by 10–50% if unaddressed |
| Temperature | 5–10% loss in hot climates |
| Soiling | 2–15% loss depending on environment |
| Mounting system | Tracking systems boost yield by 15–35% |
| Inverter selection | Efficiency and clipping affect net output |
| System degradation | 0.3–0.8% annual decline |
7. Conclusion
Calculating solar PV system generation requires understanding the relationship between irradiation, system capacity, and performance ratio. While the basic formula provides a solid starting point, accurate forecasting demands consideration of local climate, shading, mounting configuration, and component characteristics.
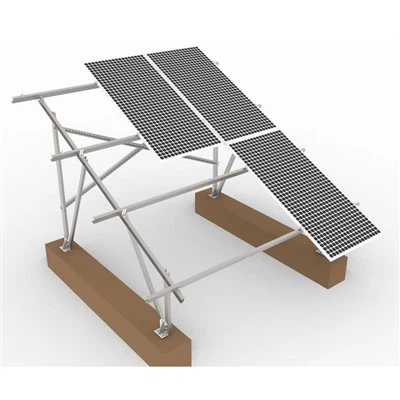
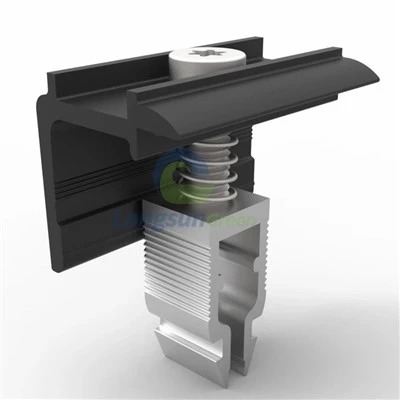
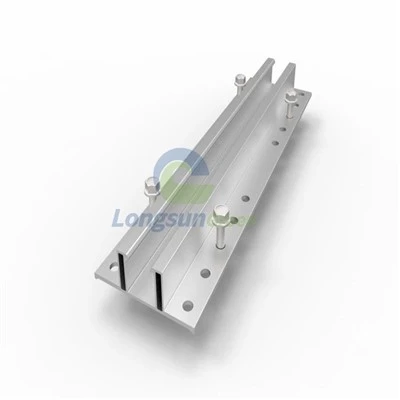
As a specialized solar mounting structure manufacturer, Longsun Green supports optimal system performance through high-quality, corrosion-resistant mounting solutions-including aluminum rails, stainless steel hooks, end clamps, and ballasted systems-engineered to maximize tilt optimization, airflow, and long-term structural reliability.